
Add or edit a sale
Add, edit or delete a sale in bluprnts — sell a product through a channel at a monthly volume, shape it with seasonality and growth, and drive your revenue.
A sale is how you forecast revenue. You take a product from your catalogue and sell it through a channel at a monthly volume over a date range. bluprnts multiplies that by the product's economics to build your revenue, gross margin and the cash that comes in — so sales are where your products turn into money.
This guide adds a sale, shapes it, then covers editing and deleting.
1. Open the Sales page#
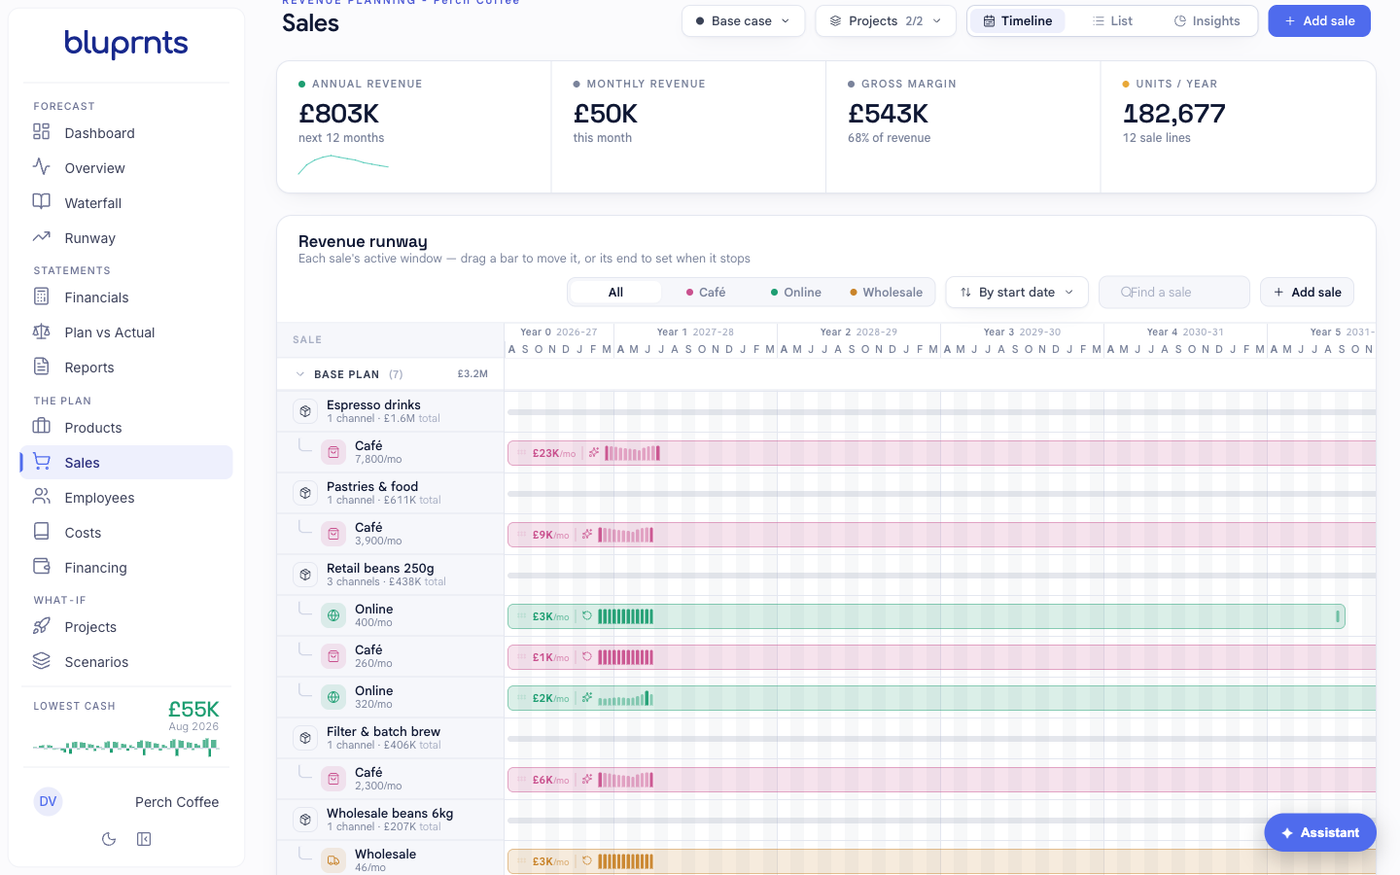
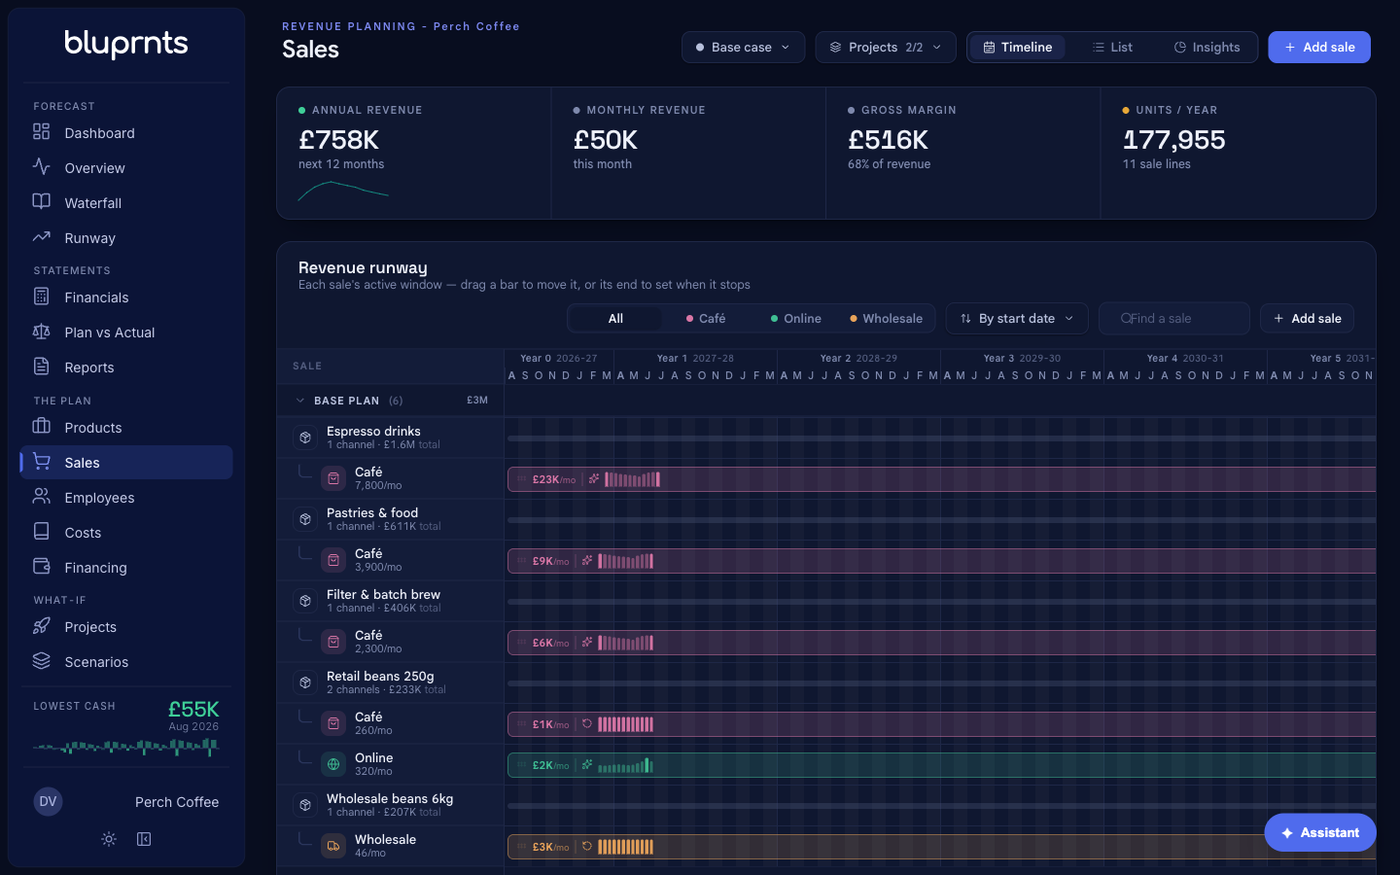
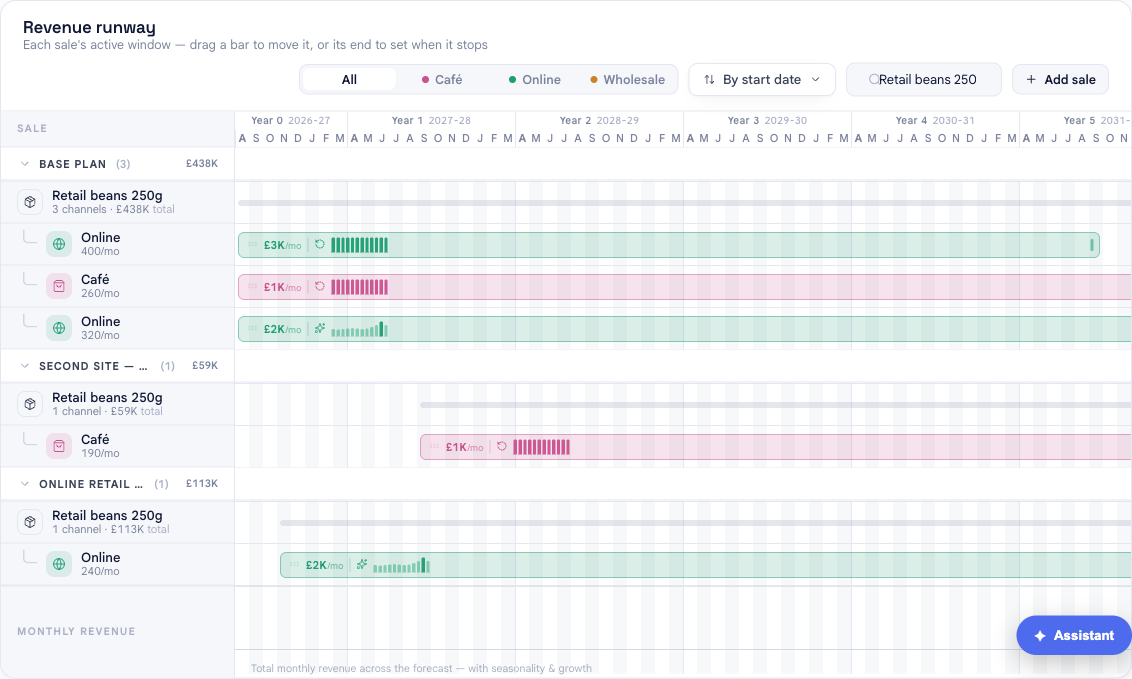
In the left sidebar, under The plan, select Sales. You will see revenue figures across the top — annual and monthly revenue, gross margin and units — and a revenue runway below, grouped by product and channel.
Select Add sale in the top right to open the panel.
2. Pick the product, channel and volume#
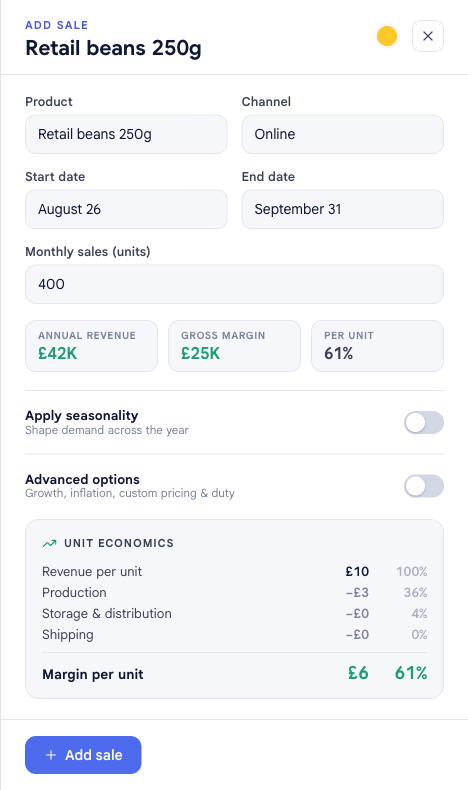
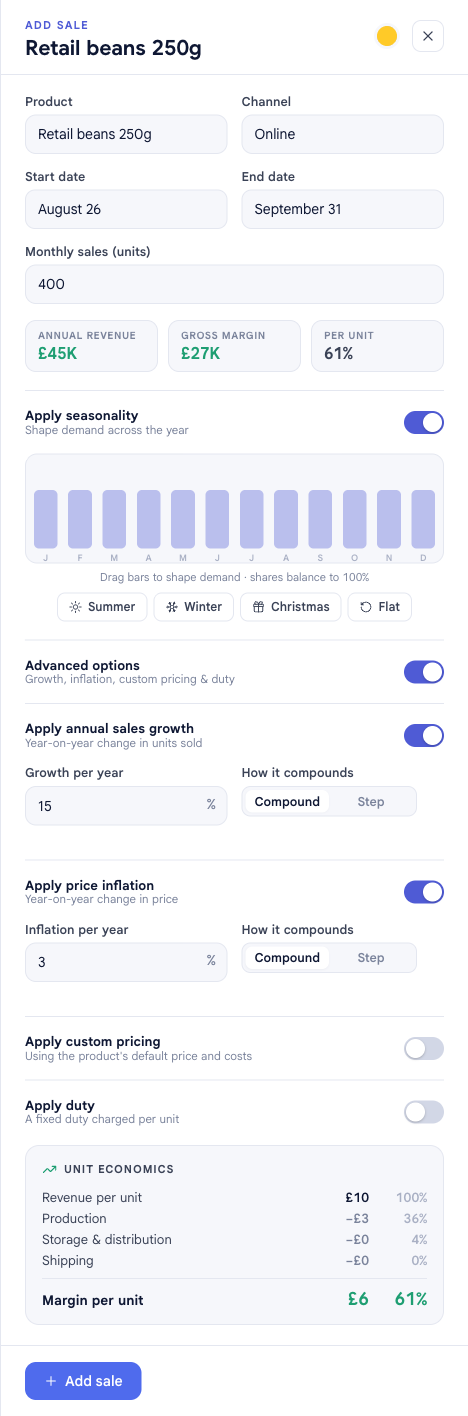
The core of a sale is four fields:
- Product — which product from your catalogue this sale sells.
- Channel — how it is sold (Retail, Online, Wholesale, Direct, or your own channels).
- Start and end date — the window the sale is active.
- Monthly sales (units) — how many units you sell each month.
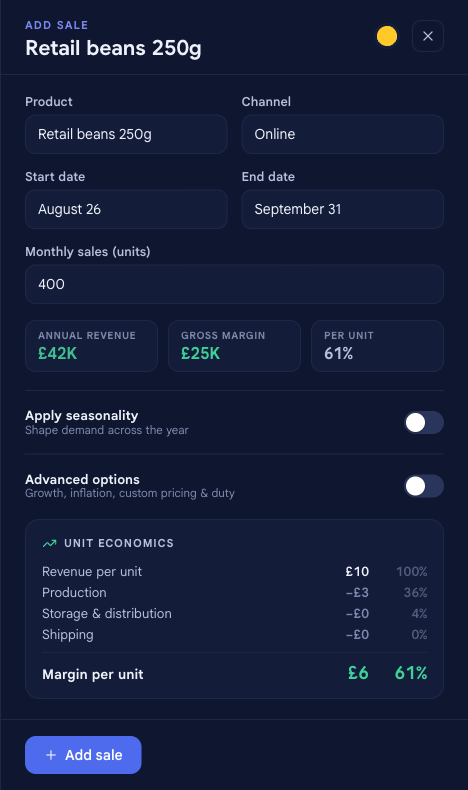
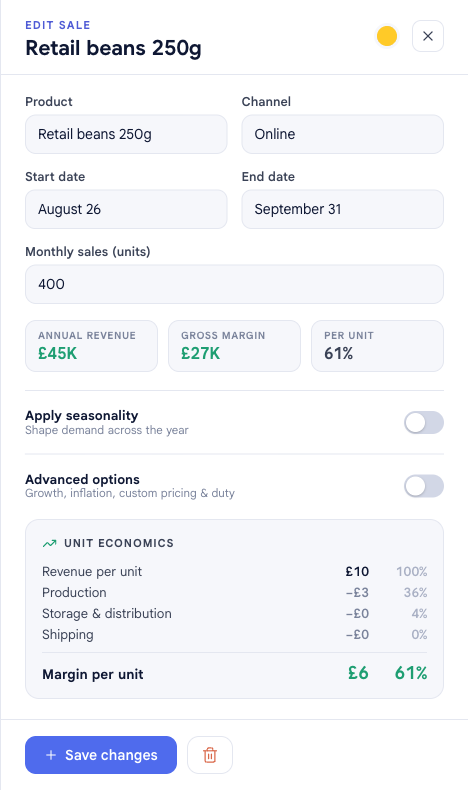
As you fill these in, the stats and the unit economics panel update live, so you can see the annual revenue, gross margin and per-unit margin this sale produces.
3. Shape it: seasonality, growth and pricing#
Real sales are not flat. Two toggles let you model how this one moves:
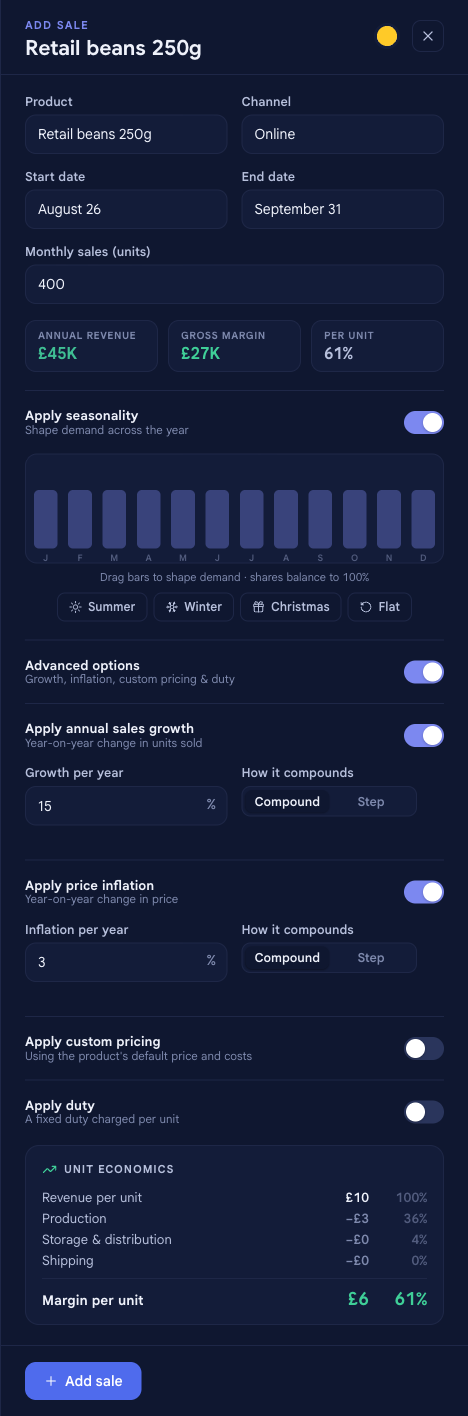
- Apply seasonality — drag the monthly bars (or use a preset like Summer or Christmas) to shape demand across the year. The weightings always balance to 100%, so you are redistributing volume, not adding it.
- Advanced options — reveals:
- Annual sales growth — year-on-year change in units, compound or step.
- Price inflation — year-on-year change in price.
- Custom pricing — override the product's price and costs for this sale, so the same product can have different economics per channel.
- Duty — a fixed duty charged per unit.
4. Check the economics and save#
The Unit economics panel breaks a single sale down — revenue per unit, each cost, and the margin per unit and percentage — so you can confirm the sale is worth making. When it looks right, select Add sale.
Your sale in the forecast#
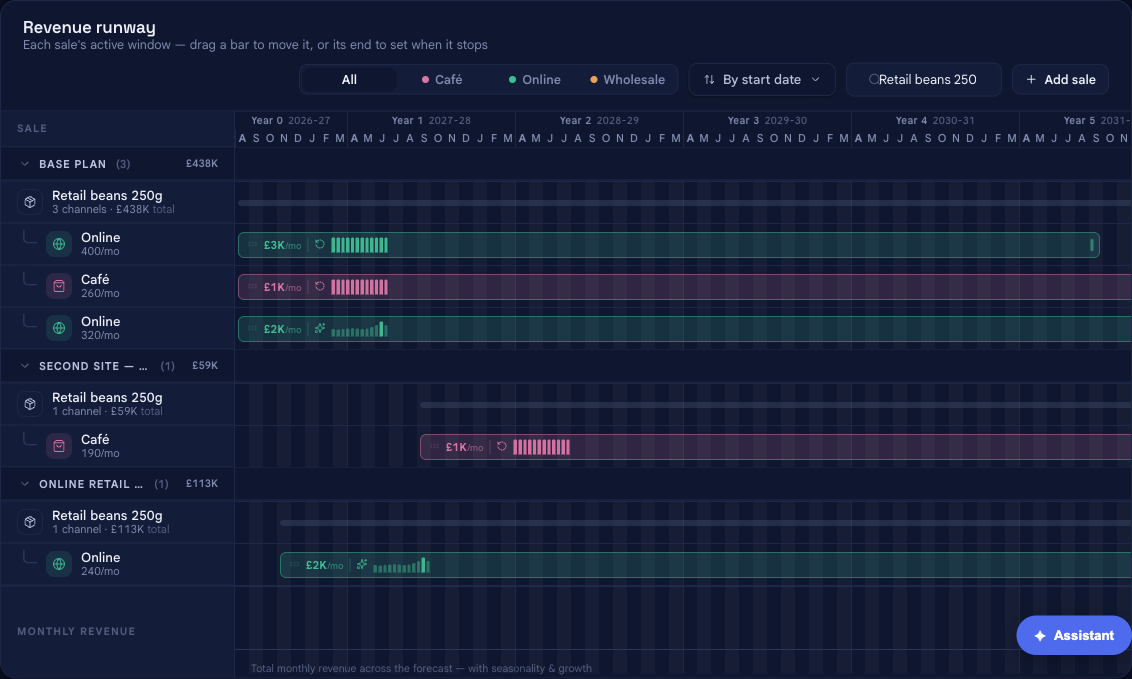
The sale appears in the revenue runway immediately, and everything it feeds updates at once: annual and monthly revenue, gross margin, units, and — because sales are the top line — your profit and loss and the cash coming in.
Edit a sale#
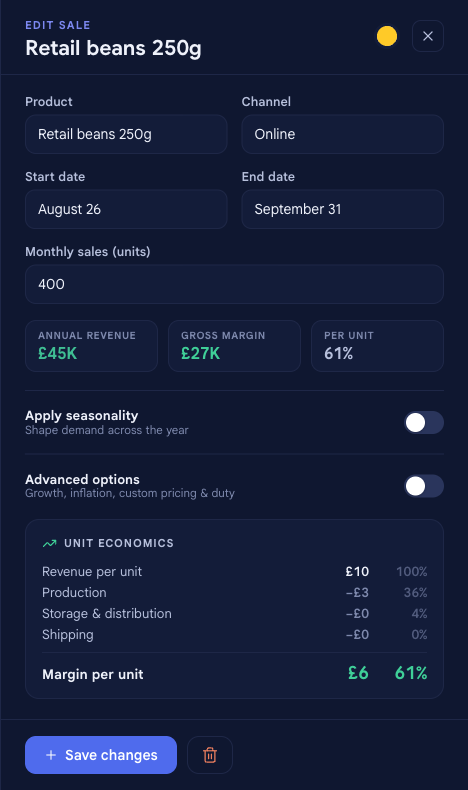
Select any sale in the runway to reopen the panel, now headed EDIT SALE, with its values filled in. Change the volume, dates, channel, seasonality or any advanced option; the stats update as you go. Select Save changes and the forecast recalculates.
Delete a sale#
While editing, select the trash icon next to Save changes to remove the sale.
To pause revenue rather than erase it, move the sale's end date in instead of deleting — that keeps the revenue it has already booked.
What a sale can model#
Beyond the units and dates, these options shape the revenue a sale produces:
| Option | What it does |
|---|---|
| Monthly sales (units) | The base volume sold each month |
| Seasonality | Redistributes that volume across the year (weightings sum to 100%) |
| Annual sales growth | Year-on-year change in units — compound or step |
| Price inflation | Year-on-year change in price — compound or step |
| Custom pricing | Overrides the product's price and costs for this sale |
| Duty | A fixed duty charged per unit |
Related#
- Add or edit a product — the catalogue a sale sells from; do this first.
- How forecasts are built — how sales and the other drivers become your statements.
- Glossary — definitions for gross margin, seasonality, channel and other terms used here.